Tom Konrad, Ph.D., CFA
2016 was generally a good year for the stock market, but the average clean energy investor did not share in the gains. Clean energy investors naturally gravitate toward exciting stocks developing solar and, more recently, electric vehicles. These technologies are bringing great benefits to the planet and customers (including me- I installed a solar array on my home in in 2014, and my wife and I just bought a Toyota Prius Prime plug-in.)
Investors’ lousy returns are due to a common problem in sectors with rapidly improving technology: Competition within the industry constantly undermines profitability. I’ve been warning about this problem since 2009, and I believe that this awareness is a large part of the reason that my “10 Clean Energy Stocks” model portfolios have outperformed the most widely held clean energy ETF, PBW, in every year except 2013. Over the nine model portfolios (2008 to 2016) have had positive returns in six of those years, compared to just two (2009 and 2013) for PBW.
2016 was no exception to this trend, with the Ten Clean Energy Stocks for 2016 model portfolio up 20%, while PBW fell 22%. Again, the culprit was solar, with the industry suffering from overcapacity and rapidly falling module prices. These low solar module prices are great for the planet and have made new solar farms able to compete with fossil generation purely on price, but they lead to non-existent profits for solar companies and investors.
With this backdrop, the list has increasingly featured a new class of stocks, Yieldcos. Yieldcos are the customers of wind and solar manufacturers because they invest in wind and solar farms. As an added bonus, they pay out most of their cash flow in the form of dividends to investors. Given my focus on Yieldcos and other green income stocks, using the beleaguered PBW as a benchmark for my list is increasingly unfair. Fortunately, a Yieldco ETF (YLCO), launched in May 2015. In 2016, I used YLCO as a benchmark for the seven income stocks in the list, and PBW as the benchmark for the remaining three. The benchmark for the whole model portfolio was a 70/30 weighted average of the returns of the two.

As you can see in the chart above, the change in benchmark did not prevent my model portfolio from producing a total return that was a full 24% ahead of its benchmark, but at least the comparison was fair.
The Green Global Equity Income Portfolio
Also shown in the chart is the Green Global Equity Income Portfolio, a private strategy I have been managing in separate accounts since the end of 2013. I’ve been exploring options for bringing this strategy to the public for the last year. Despite an excellent track record (annualized returns of 10.6% since inception) I have not yet found a mutual fund company willing to take it public. There is also a hedge fund style version of the strategy which can use shorting, uncovered put selling, and leverage. This version of the strategy has produced a 13.4% annualized return over three years.
While GGEIP is not yet available as a mutual fund, I created a long-only version on the Motif platform, the Green Equity Income Motif 2016 last year. Since GGEIP is an active strategy, I plan to launch a new version to reflect portfolio changes at least once a year.
If you’re interested in trying Motif , you can get 3 months of free trading at this link.
Investment Advisor Jan Schalkwijk, CFA at JPS Global Investments now offers a more frequently re-balanced version of GGEIP to his clients. The Folio version now has a year’s track record, and it is performing in line with the other versions of GGEIP.

So far, this is just a model without client money, so the track record does not include trading costs or fees, both of which are likely to reduce real-world performance. When trading real money, the actual trade prices can be materially different from those of a model portfolio… just as people’s results following my model portfolio will be significantly different from the numbers you find here. And, of course, past performance is no guarantee of anything, let alone future results.
If you’re interested in investing in the 10 Clean Energy Stocks for 2017 model portfolio (whatever the fture results may be), I just made it available on the Motif platform as well (or you can buy the stocks individually through your broker.)
How The Stocks Fared
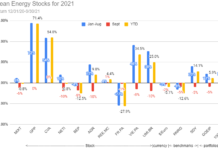
The following chart (click for full-size version) shows how the individual stocks fared. The green (yellow) bars show
the High (Low) Target I gave for each at the start of the year. A few green bars are missing where the high target is off the scale of the chart. I predicted that most of the stocks would end the year between the high and low targets. Only Enviva ended outside the range, finishing about 1% above the high target.
In the discussion below, I’ll look at how each stock performed for the year, and why. For those stocks not included in 10 Clean Energy Stocks for 2017, I’ll talk discuss my outlook and why they were dropped. My outlook for stocks included in the 2017 list can be found here.
Income Stocks
Pattern Energy Group (NASD:PEGI)
12/31/15 Price: $20.91. 12/31/15 Annual Dividend: $1.488 (7.1%). Beta: 1.22. Low Target: $18. High Target: $35.
12/31/16 Price: $18.99. 2016 Dividend (Yield): $1.58 (7.55%). Current Yield: 8.6%. 2016 Total Return: -2.0%
Wind Yieldco Pattern Energy was hurt early in the year due to low wind production because of El Nino weather conditions, and late in the year because management realized that internal accounting controls had become inadequate as the company grew. Management does not believe that any of its numbers were actually misstated and is working to correct the problem. I’m wildly enthusiastic about the stock at the current price, and it is my top pick in the 2017 list.
Enviva Partners, LP (NYSE:EVA)
12/31/15 Price: $18.15. 12/31/15 Annual Dividend: $1.76 (9.7%). Low Target: $13. High Target: $26.
12/31/16 Price: $26.80. 2016 Dividend (Yield): $2.025 (11.2%). Current Yield: 7.9%. 2016 Total Return: 60.7%
Wood pellet focused Master Limited Partnership (MLP) and Yieldco Enviva Partners was the biggest winner for the year. Although a 7.9% current yield is still decent, I expect higher yields from MLPs than other stocks because of the higher and more complicated taxes on distributions.
I also worry that if Donald Trump chooses to ignore the United States’ obligations under the Paris agreement (as it looks very likely that he will), Europeans may also slow down their efforts to reduce greenhouse gas emissions from electricity generation. This would affect Enviva’s potential long term growth because its biggest customers are European coal plants which have been converted to burn wood pellets instead. I also expected that states plans to comply with Obama’s Clean Power plan would have led to some US coal plants also being converted to burn wood pellets. That prospect is also less likely with Trump as President.
No matter what happens in Europe, existing contracts are long term and unlikely to be at risk. In fact, the European Commission recently approved a subsidy to help Enviva’s customer, Drax, pay for wood pellets produced by Enviva and burned in a converted coal power station in North Yorkshire, in the UK.
The combination of less attractive valuation and diminished growth prospects led me to drop Enviva from the 2017 list and sell my position. I will continue to watch the stock and buy again if it falls to more attractive levels.
Green Plains Partners, LP (NYSE:GPP)
12/31/15 Price: $16.25. 12/31/15 Annual Dividend: $1.60 (9.8%). Low Target: $12. High Target: $22.
12/31/16 Price: $19.80. 2016 Dividend (Yield): $1.638 (10.1%). Current Yield: 8.5%. 2016 Total Return: 35.1%
Ethanol production MLP and Yieldco Green Plains Partners also faces risks from a Trump administration. The oil industry hates the EPA’s Renewable Fuel Standard (RFS), which requires a minimum volume of ethanol to be blended with gasoline, and Trump has strong ties and large investments in the industry. His likely cabinet is also filled with oil men.
This uncertainty, along with a less attractive valuation due to gains in 2016 have led me to drop GPP from the 2017 list and sell my stake.
NRG Yield, A shares (NYSE:NYLD/A)
12/31/15 Price: $13.91. 12/31/15 Annual Dividend: $0.86 (6.2%). Beta: 1.02. Low Target: $11. High Target: $25.
12/31/16 Price: $15.36. 2016 Dividend (Yield): $0.95 (6.8%). Current Yield: 6.5%. 2016 Total Return: 17.8%
Yieldco NRG Yield’s (NYLD and NYLD/A) seems likely to remain largely unaffected by a Trump administration. Since its valuation remains attractive, it is in the 2017 list.
Terraform Global (NASD: GLBL)
12/31/15 Price: $5.59. 12/31/15 Annual Dividend: $1.10 (19.7%). Beta: 1.22. Low Target: $4. High Target: $15.
12/31/16 Price: $3.95. 2016 Dividend (Yield): $0.275 (4.9%). Current Yield: N/A. 2016 Total Return: -21.2%
Yieldco Terraform Global struggled with its former sponsor Sun Edison’s (SUNEQ) bankruptcy. This impacted its ability to file timely financial reports, and led to significant uncertainly about the company’s true value.
The company has begun to release financial data and regain compliance with NASDAQ listing requirements. I expect the company to be bought by a large company in 2017, possibly in the next few months. I expect the sale price will be between $4 and $6 per share, most likely between $4 and $5. Given the relatively modest expected gain, and the fact that I might need to find a replacement early in the year, I have dropped GLBL from the 2017 list. I maintain my personal position in the stock and in GGEIP.
Hannon Armstrong Sustainable Infrastructure (NYSE:HASI).
12/31/15 Price: $18.92. 12/31/15 Annual Dividend: $1.20 (6.3%). Beta: 1.22. Low Target: $17. High Target: $27.
12/31/16 Price: $18.99. 2016 Dividend (Yield):
$0.93 (6.5%). Current Yield: 6.3% 2016 Total Return: 6.5%
Clean energy financier and REIT Hannon Armstrong has fallen over the last two months due to rising interest rates and concern that it might lose its status as a REIT. I feel the risk of a potential loss of REIT status has been overblown.
Hannon Armstrong remains in the 2017 list. I have been adding to my position, which I had reduced for re-balancing when the stock was in the $22 to $25 range.
I almost dropped Hannon Armstrong from the list last year given the plethora of highly attractive Yieldcos at great valuations at the time. This year, keeping it was a very easy decision.
TransAlta Renewables Inc. (TSX:RNW, OTC:TRSWF)
12/31/15 Price: C$10.37. 12/31/15 Annual Dividend: C$0.84 (8.1%). Low Target: C$10. High Target: C$15.
12/31/16 Price: C$14.34. 2016 Dividend (Yield): C$0.88 (8.5%). Current Yield: 6.0% 2016 Total Return (US$): 52.6%
Canadian listed Yieldco TransAlta Renewables’ prospects are unaffected by political developments in the United States, but its large gains in 2016 have given it a less attractive valuation. It also owns significant natural gas assets, making it less green than most of the Yieldcos.
Although the RNW is not in the 2017 list, I maintain a reduced position, and might increase my stake if the price falls.
Growth Stocks
Renewable Energy Group (NASD:REGI)
12/31/15 Price: $9.29. Annual Dividend: $0. Beta: 1.01. Low Target: $7. High Target: $25.
12/31/16 Price: $9.70. 2016 Total Return: 4.4%
Advanced biofuel producer Renewable Energy Group, like ethanol producers (see the Green Plains Partners discussion above), is potentially more vulnerable to action by an administration skeptical of renewable energy than are Yieldcos.
If the EPA’s incentives for biodiesel and renewable diesel remain unchanged, the company’s profits and stock price have the potential for explosive gains. That prospect is far from certain, however, so I have dropped the company from the 2017 list and greatly reduced my personal holdings.
MiX Telematics Limited (NASD:MIXT; JSE:MIX).
12/31/15 Price: $4.22 / R2.80. 12/31/15 Annual Dividend: R0.08 (2.9%). Beta: -0.13. Low Target: $4. High Target: $15.
12/31/16 Price: $6.19 / R3.20. 2016 Dividend (Yield): R0.08/$0.138 (3.3%) Current Yield: 2.4% 2016 Total Return: 51.1%
Software as a service fleet management provider MiX Telematics is a significant potential beneficiary of a Trump administration. Many of MiX’s largest clients are part of the global oil and gas industry. The drilling revival that Trump hopes to bring about should lead these customers to buy more vehicles, and they pay MiX for fleet management on a per-vehicle basis.
Despite MiX’s significant gains in 2015, a low priced stock buyback and the improving economic backdrop return the company keep MiX Telematics in the 10 Clean Energy Stocks list and my portfolio for the third year in a row. I liked MiX at $6.50 at the start of 2015, liked it more at $4.22 a year ago, and still like back at $6.50 today. The share price does not reflect the advances the company has made over the last two years, nor does it reflect MiX’s underlying value.
Ameresco, Inc. (NASD:AMRC).
Current Price: $6.25. Annual Dividend: $0. Beta: 1.1. Low Target: $5. High Target: $15.
12/31/16 Price: $5.50. 2016 Total Return: -9.2%
Energy service contractor Ameresco looked to be recovering from a long slump before the November election. This recovery was at least in part driven by the Obama administration’s efforts to improve the energy efficiency of government operations. Although the Republicans and Trump are not openly hostile towards energy efficiency in the way they are towards renewables, it seems unlikely that it will be a priority for them.
At worst, President Trump could remove many of Obama’s energy efficiency targets for government operations with the stroke of a pen, cutting into Ameresco’s future business. With these risks in mind, I dropped Ameresco from the 2017 list and sold all my personal holdings.
Final Thoughts
The incoming President and Congress are skeptical of climate change and have yet to recognize that clean energy is far more effective at creating good paying domestic jobs than traditional fossil fuels. Trump himself is highly unpredictable and many of his election promises, if implemented, are more likely to harm than help the US and world economy. In particular, promises of increased spending and tax cuts could send the deficit and interest rates soaring. Promises to talk tough and renegotiate trade deals might even lead to a global trade war, with crippling effects on the world economy.
Against this uncertain and potentially volatile backdrop, the valuations of many defensive clean energy stocks remain attractive. A significant allocation to cash seems prudent, but investments in defensive, attractively valued companies such as my 10 Clean Energy Stocks for 2017 could still pay significant rewards.
Disclosure: Long HASI, MIXT, RNW/TRSWF, PEGI, NYLD/A, REGI, GLBL. I get $1 when someone buys any of my created Motifs.
DISCLAIMER: Past performance is not a guarantee or a reliable indicator of future results. This article contains the current opinions of the author and such opinions are subject to change without notice. This article has been distributed for informational purposes only. Forecasts, estimates, and certain information contained herein should not be considered as investment advice or a recommendation of any particular security, strategy or investment product. Information contained herein has been obtained from sources believed to be reliable, but not guaranteed.


