by Vic Patel
There are over a dozen major Clean Energy ETFs available to investors. But which one is the best one to put your hard earned money into? Best can mean different things to different people based on their investment preferences and risk profile.
In this article, I will provide a more empirical based reason behind why I believe that PZD is the most attractive Clean Energy ETF at the moment. I have based on my analysis of 4 primary factors: liquidity, diversification, recent price action, and last but not least expense ratio.
Liquidity has to be a major consideration in the selection of any financial asset. The lack of sufficient liquidity can lead to wider bid ask pricing, and difficulty in efficient trade execution
Top 5 Most Liquid Clean Energy ETFs (based on 3 month Avg. Daily Volume)
TAN – 135,000
PZD – 7,512
ICLN – 79,979
PBW – 13,373
QCLN – 15,318
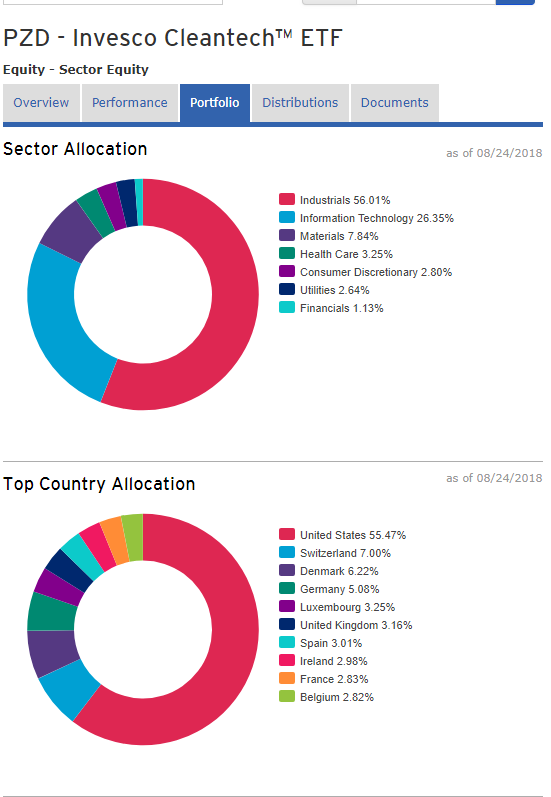
Since I always want to reduce risk through diversification. ETFs with a larger numbers of holding and a lesser concentration in the top 10 are the most diversified. So, next, I analyzed the number of holdings within each ETF and the concentration of its’ top 10 holdings. You will find the results of that below.
Number of holdings
PZD 51 (31% concentration in top 10 holdings)
PBW 40 (36% concentration in top 10 holdings)
ICLN 31 (55% concentration in top 10 holdings)
QCLN 39 (57% concentration in top 10 holdings)
Clear Winner: PZD
From here, I took a look at the price chart of each ETF on our list. What I primarily wanted to see for each was where the current price was trading in relation its 200 period moving average. The 200 period moving average is a widely watched metric by technical traders, in particular retail trend traders. When price is above the 200 period moving average, this group tends to stay on the long side of the market, and when price is below the 200 period moving average they opt to stay flat or on the short side of the market.
This can sometimes bolster prices or place additional pressure on the price of the ETF depending on the where price is trading in relation to this 200 MA. As such, we want to align our position with that order flow whenever possible. So, when prices are trading above it, it is considered a bullish sign. And contrary to that, when prices are trading below the 200 period moving average, it is considered a bearish sign. Essentially, I wanted to filter out any of these ETFs that were trading below their 200 period moving average.
PZD, PBW, and QCLN made the cut, as each was trading above its 200 period moving average. ICLN and TAN however needed to be filtered out due to their trading below its 200 period moving average.
So now we are down to three. The final piece of analysis involved comparing each of the remaining three ETFs to see how their Expense Ratios measured up. The results are below:
Expense Ratio Comparison
PZD .68
PBW .70
QCLN .60
The expense ratios seem to be relatively similar for all three, so there is no clear winner or loser there.
Conclusion
So here what PZD (Invesco Cleantech ETF) has going for it and the reason I believe it is the best Clean Energy ETF to buy:
- PZD is a relatively liquid ETF.
- PZD has the largest number of holdings and the least concentration in the top 10% of its holdings.
- PZD is trading above the 200 period moving average.
- PZD has a reasonable expense ratio based on its peer class.
This market analysis was done by Vic Patel, He is an experienced trader with over 20+ year in the markets. He also runs a popular trading blog at Forex Training Group.
**Data Source – ETFDB.com


