Third quarter reflects strong growth and new market entrants
Overview
The green bond market has kept its strong pace in Quarter 3 2017, reaching a total of USD27.7bn from July to September.
On September 28th, the total amount of green bonds issued in 2017 ytd (USD83.2bn) overtook last year’s total issuance of USD81.6bn.
We covered the big moment in our Blog Post here.
Lots of new issuers
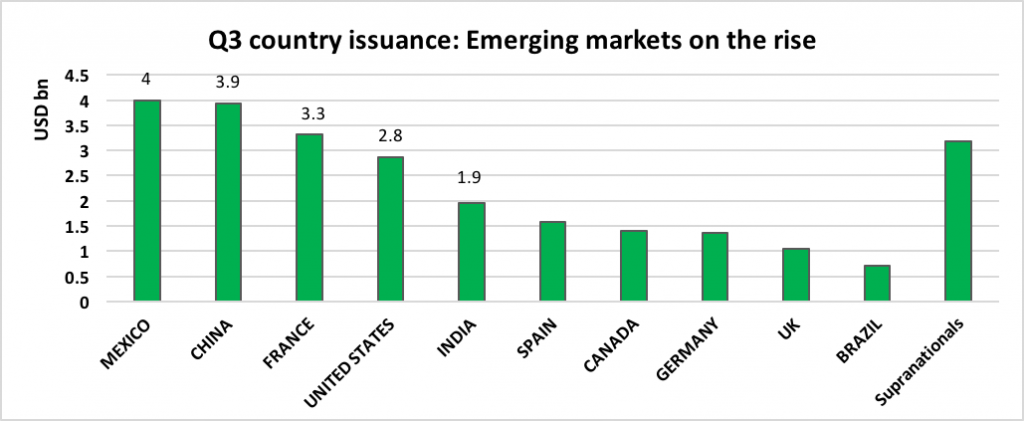
The top sources of issuance were:
- Mexico – USD4bn
- China – USD3.9bn
- France – USD3.3bn
- U.S. – USD2.8bn
- India – USD1.9bn
Mexico was a surprising addition to the number one spot, after issuing no green bonds in Q1 or Q2 this year.
Big firsts came during Q3, with 52% of issuances being from first-time issuers. First ever green sukuk and inaugural green bond from Malaysia with Tadau Energy (USD58.5m), along with a debut from Lithuania (Lietuvos Energija – USD342.5), brought further geographic expansion and diversity in financial instruments to the market.
24% of new issuers were from China and 18% from the U.S. Read more in the Q3 Report here.
Key figures
- Second largest quarter of issuance EVER
- Total USD27.7bn bringing the 2017 total to USD85.2bn
- 75 green bond deals
- 65 new issuers representing 52% of issuances
- Green Bond transactions accounted for approximately 2.7% of global bond market transactions
- Top 5 largest issuers of Q3: Mexico City Airport (USD4bn), Engie (USD1.5bn), EIB (USD1.4bn), Asian Development Bank (USD1.25bn), TD Bank and Greenko equally placed (USD1bn each)
Underwriters League Table
The Q3 table shows Citi, HSBC and JP Morgan taking top spots for Q3, with JP Morgan being the biggest mover from the combined Q1/Q2 table.*
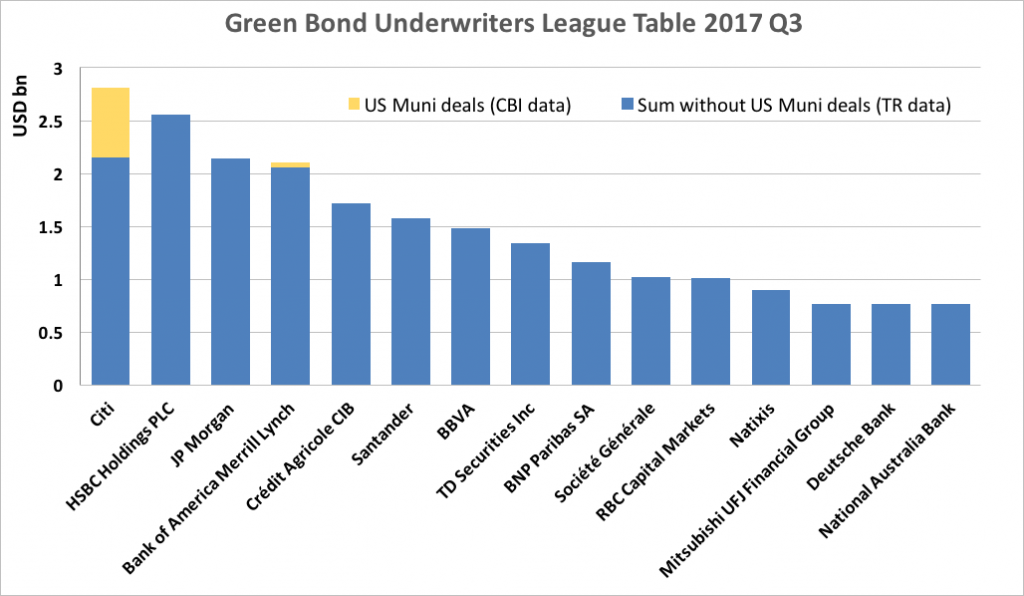
Amongst the familiar faces, Canadian based TD Securities and RBC Capital Markets make a debut and National Australia Bank makes an appearance in the #15 position.
Download the full Q3 report here.
We got our fingers crossed that in the wake of COP23 we’ll reach the easily achievable $130bn forecast.
‘Till next time,
Climate Bonds
P.S: Previous Market Update Reports:
Green Bonds Mid-Year Summary Q1Q2 2017 available here.
Green Bond Highlights for 2016 available here.
*The League table data is produced via a collaboration between Climate Bonds and Thomson Reuters. Information on Thomson Reuters methodology and data is set out at the conclusion of the report.
Disclaimer: The information contained in this communication does not constitute investment advice in any form and the Climate Bonds Initiative is not an investment adviser. Any reference to a financial organisation or debt instrument or investment product is for information purposes only. Links to external websites are for information purposes only. The Climate Bonds Initiative accepts no responsibility for content on external websites.
The Climate Bonds Initiative is not endorsing, recommending or advising on the financial merits or otherwise of any debt instrument or investment product and no information within this communication should be taken as such, nor should any information in this communication be relied upon in making any investment decision.
Certification under the Climate Bond Standard only reflects the climate attributes of the use of proceeds of a designated debt instrument. It does not reflect the credit worthiness of the designated debt instrument, nor its compliance with national or international laws.
A decision to invest in anything is solely yours. The Climate Bonds Initiative accepts no liability of any kind, for any investment an individual or organisation makes, nor for any investment made by third parties on behalf of an individual or organisation, based in whole or in part on any information contained within this, or any other Climate Bonds Initiative public communication.


