By Harris Roen
Alternative energy became a serious market player after the turn of the millennium. Since that time, solar, wind, smart grid and other alternative energy stocks have experienced both strong up and down trends. The forces at work driving these markets are complex, counterintuitive, and sometimes mysterious. This article looks at what has been driving the price of alternative energy markets, and as a result, alternative energy company stocks. Looking ahead, we will also consider what should affect the direction of alternative energy stock prices.
Past trends in Alternative Energy Stocks

The Wilder Hill New Global Index (NEX) is a fitting proxy to track overall alternative energy markets. This index contains companies that “focus on generation and use of cleaner energy, conservation and efficiency, and advancing renewable energy generally.” The chart at right shows some of the clear trends the alternative energy sector has had in the recent past.
The first down channel on the chart coincides with a general stock market slump. This drop started during the eight month recession which began in March 2001.
By 2003, alternative energy stocks started to turn around. This marked the beginning of a fantastic five year run, as investors started noticing wind power and photovoltaics were becoming economically viable alternatives to traditional electric generation. Annualized returns in this five year period averaged a remarkable 38%!
The Great Recession then hit in December 2007, just as alternative energy stocks appeared to be ascending into nosebleed territory. As a result, prices came crashing down a painful 71% in about a year. This outstripped the distressing declines the stock market in general had at that time.
After this crash, no clear trend emerged until the end of 2012, when the next up-channel started. At that time, investors felt that alternative energy stock prices better reflected the economic realities of the underlying business, and started buying again. There is likely another reason, though, that it took five years for alternative energy markets to recover. Psychologically, after getting severely burned in the crash of 2008, it took a long time for investors to feel comfortable dipping their toes back in the water.
Following the uptrend that went from 2012 to the beginning of 2014, there was a noteworthy giveback. The NEX fell 21% in about nine and a half months. Much of that giveback has been regained. It remains to be seen if the current trend will continue to be positive, or if we have entered into a sideways market.
Do Fossil Fuel Prices Drive Alternative Energy Markets?
Are fossil fuel prices the main driver of failure or success of green energy companies? Though this seems like a reasonable theory, the answer, in my analysis, is that it depends.
Alternative Energy versus Oil
 Most of the larger alternative energy stocks are multinational corporations that are part of an international economy. As a comparison, crude oil prices are good indicator of global fossil fuel values. Oil is a worldwide commodity that can more easily flow to markets than coal or natural gas. The latter two fossil fuels are subject to local supplies and disruptions, so prices can range widely by region.
The chart at right shows crude oil (Cushing OK spot) as compared to the NEX over two time periods. From 2001 to 2009, oil and alternative energy prices were very strongly linked. For you math wonks, the two had a correlation coefficient of 0.87, which is extremely significant. This makes sense, since a rise in oil prices would mean that other energy alternatives become more attractive. From 2010 to the present, the NEX had a slight negative correlation to oil prices. The two markets did not exactly go in opposite directions, but they had virtually no corresponding movement.
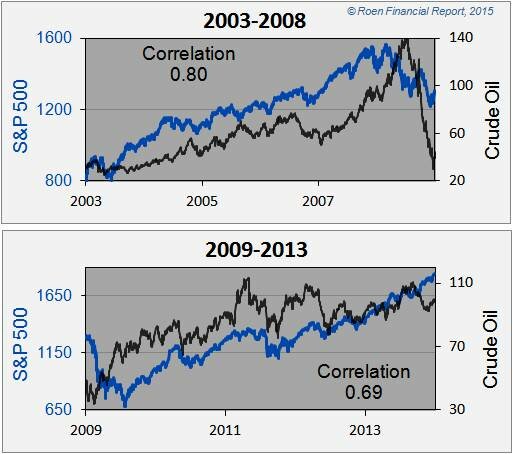 A further reason for the 2002-2009 correlation is that the economy was humming along very well at that time. This helped fuel investor optimism that the market would continue to grow for solar, wind, and the like. Similarly, oil became a strong proxy for the stock market at that time, as speculators started investing heavily in oil. They believed that as the global economy expanded, there would be more demand for oil, thus raising the prospects for oil prices. In essence, oil became a proxy for the stock market.
The correlation between oil and the stock market remained strong for a decade, but finally started to diverge at the end of 2013. Since then there has been a strong negative correlation.
 Oil prices are now being affected more by supply and demand. Much of this has to do with the North American oil and natural gas boom, which is injecting an abundance of supply right where it is being used. This not only tips the supply/demand equation by reducing U.S. oil imports, but also mitigates the fear that oil prices will skyrocket when a crisis crops up in the Middle East. For this reason, I expect any rise in oil prices going forward will positively affect alternative energy stocks.
Alternative Energy versus Natural Gas

Often, the decline in alternative energy electricity generators such as wind and solar has been attributed a drop in natural gas prices. There is a correlation between the two, though it is not as strong as one might think.
The charts at right show natural gas (Henry Hub LA spot) compared to the NEX. There is a clearly a correlation between the two, though it is somewhat weak. It is also interesting to note that at starting around 2015, there was a divergence between natural gas prices and the NEX.
Prospects for Alternative Energy Stocks
Though no one can tell with certainty where alternative energy stocks will head in the future, there are factors that can shed some light on the long-term prospects for this sector. These include increased manufacturing efficiencies, financial innovations and energy policy.
Efficiencies
Much of what many alternative energy companies do is similar to tech sector stocks. As product design and production engineering keeps improving, manufacturing efficiency can greatly help a company’s bottom line. Whether its photovoltaics, LED lighting or wind arrays, the cost of production continues to drop for green economy companies. This trend shows no signs of abating, which bodes well for alternative energy investors.
Financial Innovations
The alternative energy sector has profited greatly from new and innovative financial models. Companies like SolarCity (SCTY) and SunPower (SPWR) have benefited from various financial arrangements that allow consumers to install solar with no upfront costs. These include lease arrangements, power buyback agreements, and securitization of tax benefits.
Another innovative financial model to benefit alternative energy is the advent of renewable YieldCo’s. These are companies that bundle solar and wind generating assets into predictable cash flows that are paid out in dividends. This innovation allows green investors can choose from several companies with strong yield attributes.
Investors love dividends, especially in this low interest rate environment. Any added yield an investor can put in their portfolios is of great value. YieldCo’s should continue to attract investors and lead to higher stock prices.
These types of financial innovation reflect a maturing of the alternative energy sector, which I see as a good sign. As long as these products have strong fiscal underpinnings, the prospects for long-term growth remain healthy.
Energy Policy
Because of the public good that results from reduced fossil fuel use, alternative energy has benefitted from government policies supporting the industry. Indeed, targets and incentives remain strong internationally, particularly in Europe and Asia. These regions and others continue to be serious in their commitment to solar, wind, energy storage, efficiency and other alternative energy strategies. Domestically, there are two important policy developments to watch, one a carrot and one a stick.
The first important domestic incentive is the Business Energy Investment Tax Credit (ITC). The ITC rebates up to 30% for solar, fuel cells, wind, combined heat and power (CHP) and geothermal. This incentive is scheduled to sunset at the end of 2016. Whether it gets renewed or not will affect the rate at which renewable projects go forward. This will cause concern for investors.
The second policy development is the Clean Power Plan. These proposed rules from the EPA target pollution reduction from power plants, and will have a vast affect on how energy gets produced and consumed in the country. Essentially each state has an emission target, which will force it to find ways to reduce carbon emissions. There has been some strong pushback from many states, especially those heavily reliant on coal for production electricity. The rule making process will likely take a few years and several court cases to resolve, but if the Clean Power Plan remains mostly intact, it will accelerate renewable energy projects in a big way.
Conclusion
By keeping an eye to the ground on fossil fuel prices, energy policies and other factors, investors can go far to understanding prospects for alternative energy stocks. There will undoubtedly be up and down swings ahead, but there are enough positives underlying the sector that we remain bullish for the long-term.
DISCLOSURE
Individuals involved with the Roen Financial Report and Swiftwood Press LLC do not own or control shares of any companies mentioned in this article. It is also possible that individuals may own or control shares of one or more of the underlying securities contained in the Mutual Funds or Exchange Traded Funds mentioned in this article. Any advice and/or recommendations made in this article are of a general nature and are not to be considered specific investment advice. Individuals should seek advice from their investment professional before making any important financial decisions. See Terms of Use for more information.
About the author
Harris Roen is Editor of the “ROEN FINANCIAL REPORT” by Swiftwood Press LLC, 82 Church Street, Suite 303, Burlington, VT 05401. © Copyright 2010 Swiftwood Press LLC. All rights reserved; reprinting by permission only. For reprints please contact us at cservice@swiftwood.com. POSTMASTER: Send address changes to Roen Financial Report, 82 Church Street, Suite 303, Burlington, VT 05401. Application to Mail at Periodicals Postage Prices is Pending at Burlington VT and additional Mailing offices.
Remember to always consult with your investment professional before making important financial decisions.