Charles Morand
Last week, I conducted an analysis showing the lack of evidence supporting claims that oil and alt energy returns are strongly correlated (claims that sometimes come from outfits as reputable as Bank of America Merrill Lynch).
I don’t want to belabor this topic but I thought I would post the results of another, similar analysis I conducted following comments I received on how to improve the first one. In a nutshell, the comments suggested I do the following:
1) Look at daily correlations or even smaller periods, as “common knowledge” market movements can often dominate over the real relationship in the short and very short run
2) Look at absolute (price) correlations as well as relative (return) correlations (my first analysis looked only at relative movements)
3) Look at directionality (i.e. what % of the time do assets X and Y move in the same direction regardless of the size of the move)
4) Extent your analysis to five years or greater
New Analysis, Same Difference
The three sets of tables below show daily return correlation coefficients, daily price correlation coefficients and daily directionality statistics (% of days that the assets close Up, Down or No Movement together) for oil, nat gas, the S&P 500 and alt energy stocks.
The time periods have been extended from three to five years or since inception. The oldest alt energy ETF available is PBW that was listed on March 03, 2005 – not quite 5 years but a decent chunk of time nonetheless. The other 3 ETFs (sector specific) were all listed in the 2nd half of 2008.
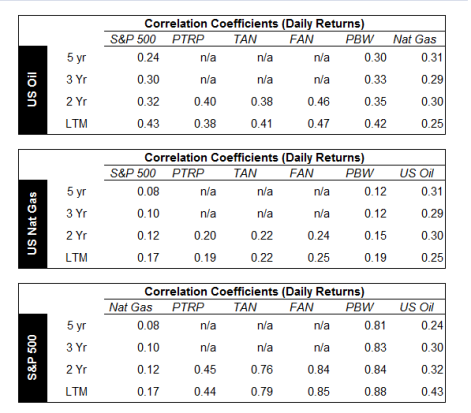


The first set of tables show that returns on oil are not particularly useful at explaining returns on alt energy stocks on a daily basis (let’s say that we enter useful territory at 0.5 and above), although the results for PBW show the relationship strengthening somewhat in the last year (which has been anything but a normal year for the markets). These results are in line with those from my previous analysis which looked at weekly returns.
As far as absolute prices go (the second set of tables), correlation coefficients for oil and alt energy are high, but they are just as high if not higher for alt energy and the S&P 500. PBW shows the relationship strengthening over time, but it strengthened even more between oil and the S&P 500, something Tom opined might be the case a few months ago.
I don’t find absolute price correlations all that useful. In the medium and long terms, returns matter far more than absolute prices. If a $1 movement in oil consistently results in a $1 movement in an alt energy ETF over the long run, the high coefficient could obscure a divergence trend between the returns on both assets as their prices rise.
Finally, the directionality tables (note that assets appear in a different order) show a fair bit of co-directionality between oil and alt energy (with the exception of PTRP [alternative transportation], something Tom and I discussed last week). But here again, the S&P 500 emerges as the stronger predictor.
Conclusion
I did not go any more granular than daily data: anything beyond that becomes relevant only to traders.
Once again, the general conclusion that emerges from this analysis is that oil – whether in terms of returns, prices or directionality – is not a particularly useful indicator to go by when investing in alt energy stocks, especially when compared to equity markets in general (i.e. the S&P 500).
The implication for investors is that they should not invest in alt energy as a hedge against or a play on rising oil prices. If anything, what little relationship does exist will probably tend to disappear overtime as alt energy and cleantech stocks respond more to core business fundamentals than to seemingly logical yet unproven narratives about external drivers.
DISCLOSURE: None


What about correlation with a lag?
Hi, Charles –
Actually,. Alternative energy usually goes to electrons, not transportation. . . so no, there would not be much correlation . . .
Yes, that’s exactly my point. That’s also why I looked at nat gas as well as crude.
Now try telling this to the popular press or the talking heads at CNBC. People want to believe that there is a correlation because it makes for a good soundbite. Explaining how things actually work doesn’t interest anyone if it takes more than 10 seconds.
Martha,
Such a correlation could arise anyway:
• nat gas is correlated with oil, and nat gas is used extensively for electricity generation
• Sentiment: when gas prices rise, people think more about Alt-E, even if there is no economic connection.
Well, we have somehow managed to convey that global warming exists. . .so we should somehow figure out how that got across, and reproduce the effect. . .recognizing that some people will never get it. . .
Thanks,
Tom:
Excellent idea. I’ve never done anything like this before but I can definitely see how it could yield interesting results.
My expectation is that oil prices will trend up but equities will be flat or declining over the next 24 months, so this would provide an interesting environment to test this in.
In terms of PTRP, which we discussed last week, I wouldn’t expect that correlation to materialize in the near term and could definitely see it being lagged as government expenditures tend to grow in a step-like fashion rather than linearly or otherwise.